

-
Termékek

-
Kvantifikáció, analitika, detektálás
-
Beckman, Opentrons, Promega folyadékkezelés, DNS izoláló robotok
- EMnetik 24 PCR Cleanup + Plasmid Purification System

|
EMnetik 24 PCR Cleanup + Plasmid Purification System |


DNA Cleanup for Genetic Engineering
Monotonous, time-consuming column cleanup has been around since 1991—so a change is long overdue. And now it’s here. Replace your typical column cleanup steps with the benchtop EMnetik 24 System. You’ll spend half the time on PCR cleanup, which means you’ll have more time for the important activities in your lab. Bring your PCR cleanup and plasmid prep into the 21st century.
Monotonous, time-consuming column cleanup has been around since 1991—so a change is long overdue. And now it’s here. Replace your typical column cleanup steps with the benchtop EMnetik 24 System. You’ll spend half the time on PCR cleanup, which means you’ll have more time for the important activities in your lab. Bring your PCR cleanup and plasmid prep into the 21st century.
ÁRAJÁNLATOT, INFORMÁCIÓT KÉREK!
Benefits of the EMnetik System:
- ~2x faster turnaround time compared to column cleanups (16 min vs 30 min)
- >80% recovery (comparable to column cleanup kits)
- Significantly fewer touchpoints (< 50 touchpoints compared to 300 for columns)
- No need to handle small columns or use a single-channel pipette
- Move samples from a thermocycler to the EMnetik 24 system, and don’t move them again until final elution
- Intuitive user interface removes guesswork by providing clear, step-by-step instructions
Column-based cleanups are officially history.
Műszaki specifikációk

Applikációk
EMnetik PCR System Performance Data
PCR Cleanup - Simplified
- ~2x faster turnaround time compared to column cleanups (16 min vs 30 min)
- >80% recovery (comparable to column cleanup kits)
- Significantly fewer touchpoints (< 50 touchpoints compared to 300 for columns)
- No need to handle small columns or use a single-channel pipette
- Move samples from a thermocycler to the EMnetik 24 system, and don’t move them again until final elution
- Intuitive user interface removes guesswork by providing clear, step-by-step instructions
Choose your sample input, elution and labware.
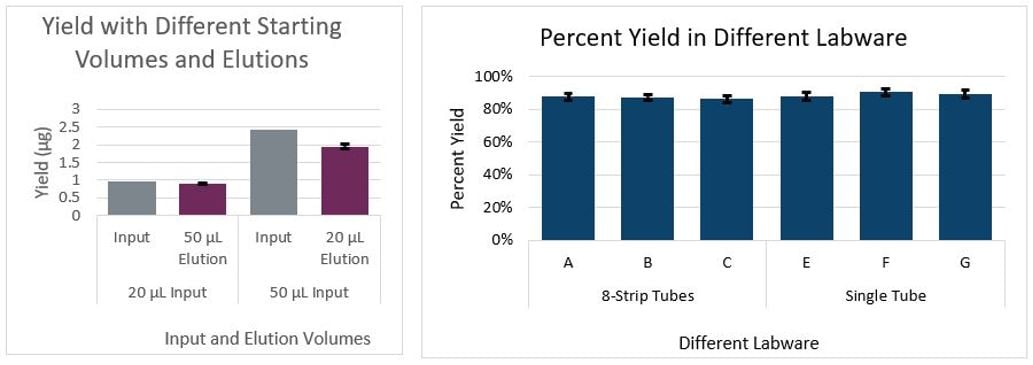
Figure 1
These graphs demonstrate your flexible options.
Figure 1 left: Yield of elutions from 2 different starting inputs and 2 different elution volume options (50 µL and 20 µL). Bars indicate the average of 9 replicates on the device; error bars indicate the standard deviation of the replicates. Figure 1 right: Yield does not vary widely when using different labware. The first three bars show the yield using PCR 8-strip tubes, and the second three bars show the yield using single PCR tubes. The bars represent the average of 8 samples; error bars indicate the standard deviation of the 8 samples. Tubes are as follows: A: Thermo Scientific AB-2005, B:VWR 93001-118, C: VWR 20170-002, D: Thermo Scientific AB-0337, E: VWR 20170-010, and F: VWR 20170-012.
DNA is stable in the spinning magnetic beads.
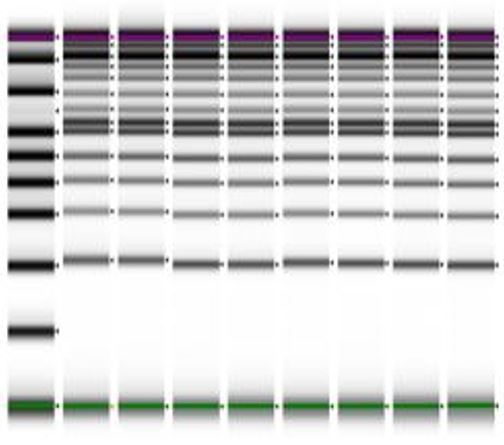
Figure 2
Figure 2: To test that DNA was not degraded during the automatic bead mixing or separation, a ladder was used as input lanes; 1 and 2 show the input ladder and lanes 3 - 8 show the ladder after cleanup. All bands can be seen in all lanes, i
Tartozékok, kiszerelések

Videók, ismertetők
Újdonság
Újdonság
![]() Forgalmazott termékeink gyártói - keressen gyártó szerint a logóra kattintva
Forgalmazott termékeink gyártói - keressen gyártó szerint a logóra kattintva
